# Using the debugger console
Beside the code editor on the "Source code" tab, you'll see our debugger console which allows you to test the connections, actions and triggers of your connector before releasing it. This debugger console allows you to run tests on the latest version of your custom connector code.
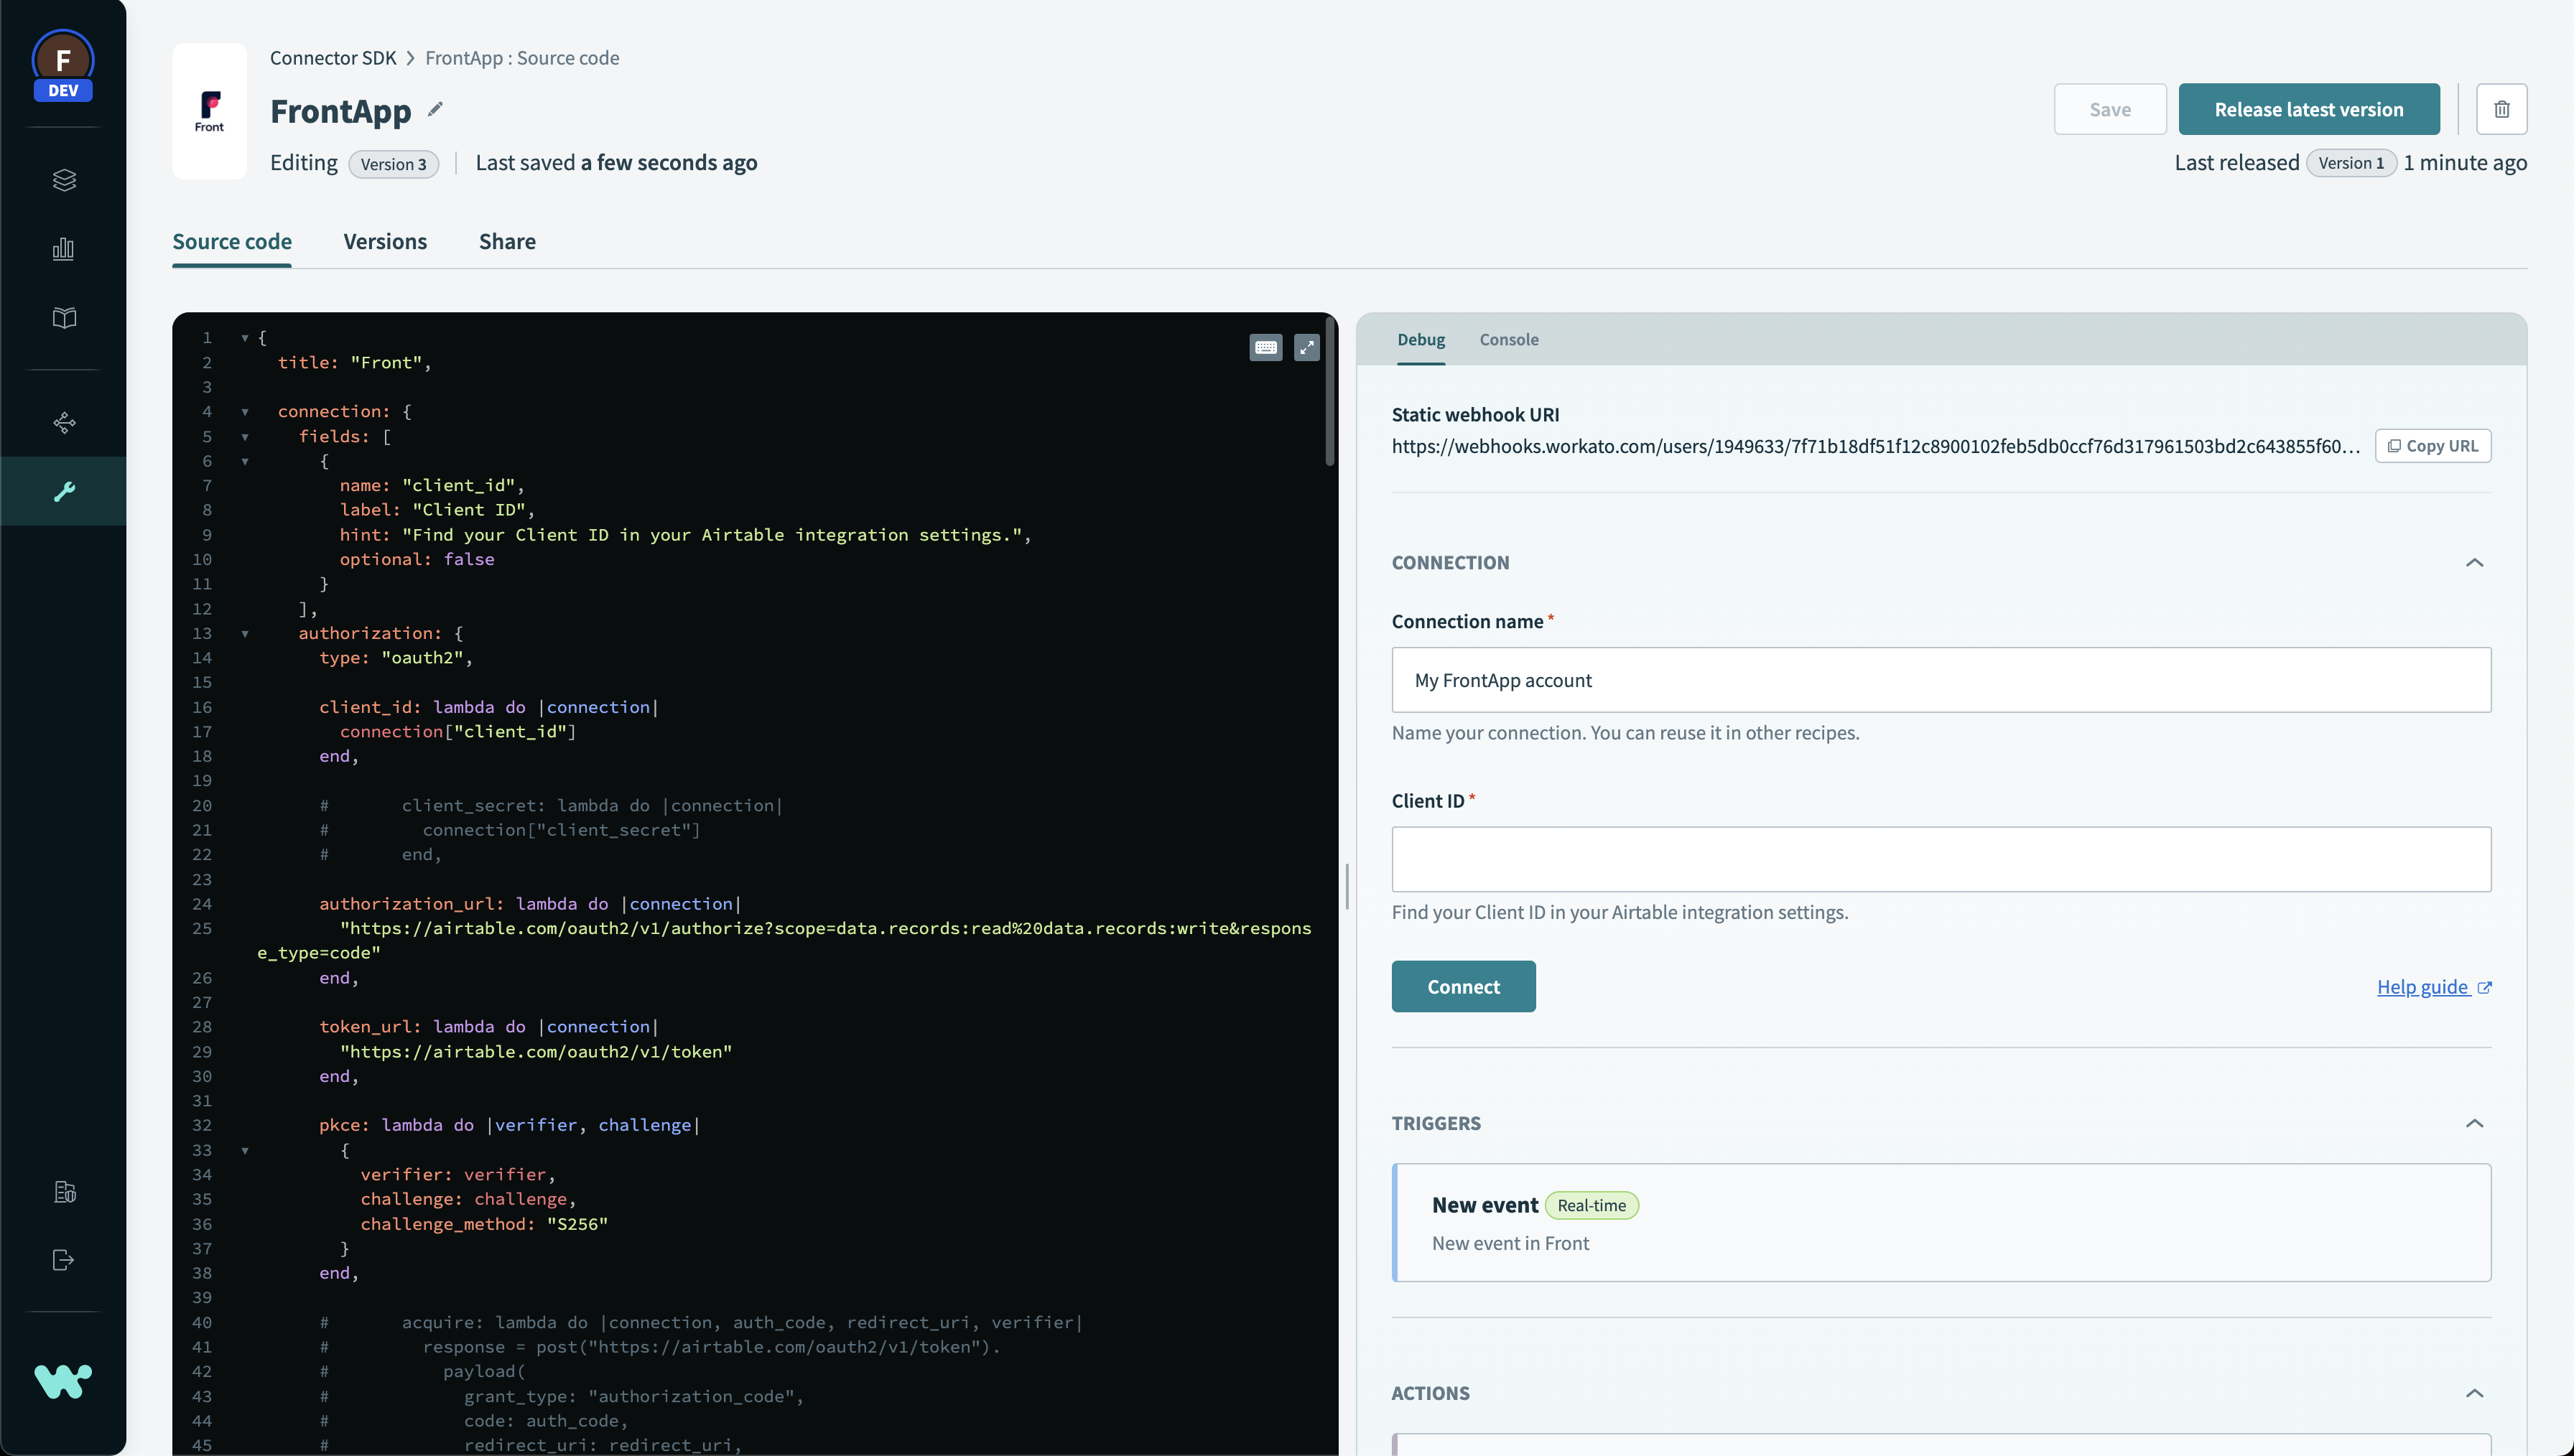 Debugger console
TIP
The debugger console always runs on the latest version of your connector code currently in your code editor. Any unsaved changes that are currently in the code editor will result in the custom connector creating a new latest version before running any tests are executed. There will be a notification to tell you when this is the case.
In cases when there is an error in your latest version, any connections, actions and triggers will be hidden instead. Fix the error so you can start testing again.
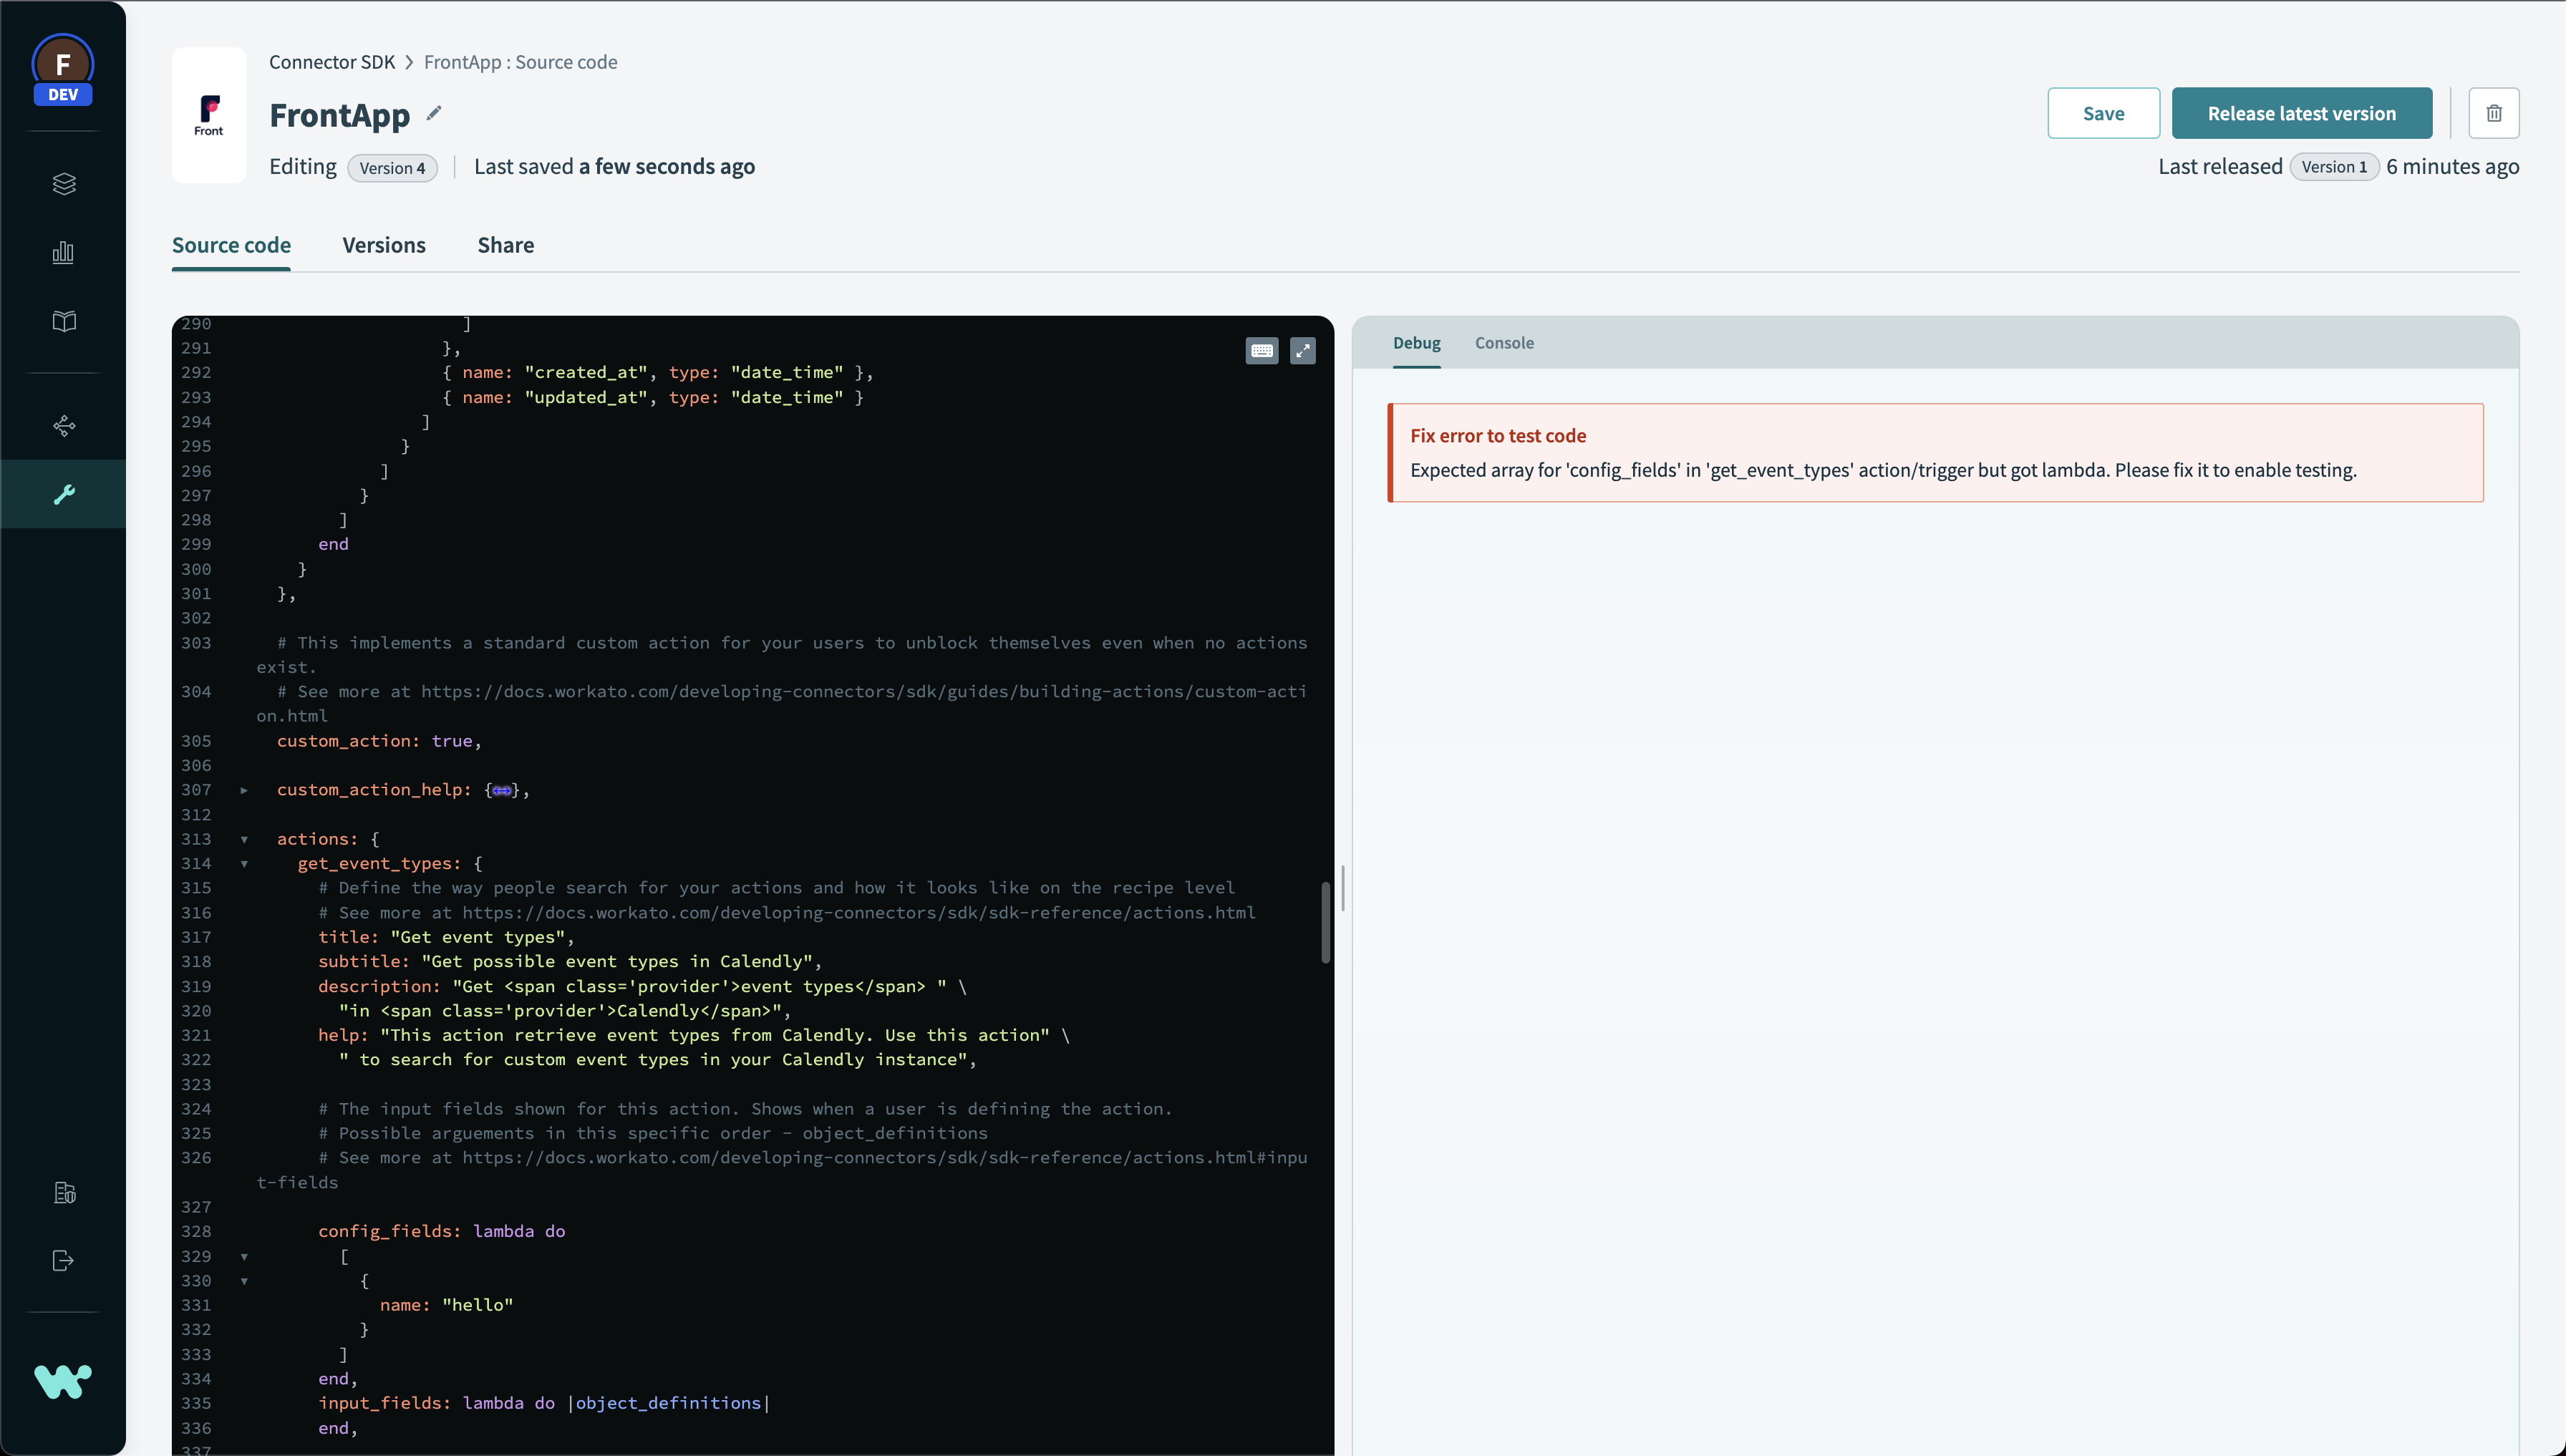 Debugger console when there is a syntax error
# Testing a connection
When using the debugger console, the first thing you need to do is establish a successful connection. After defining the connection inside the source code, you'll be testing this connection immediately in the connection tab of the debugger console.
When the connection you make is successful, the debugger will immediately display a "Connection success" message to let you know. This connection you just established will be used as the connection for any tests that you execute in the debugger console following this.
You can't test actions or triggers until a successful connection is made. Without a successful connection, HTTP requests sent during triggers and actions would not be able to actively authenticate itself with the API endpoint.
Find out more about configuring a connection in our SDK and what connection types we support. Learn more through our guides.
# Testing actions and triggers
After establishing a successful connection, you'll be able to test any actions and triggers you have defined using the debugger console.
TIP
Use full screen mode for an easier experience as you cycle through writing and testing your connector code.
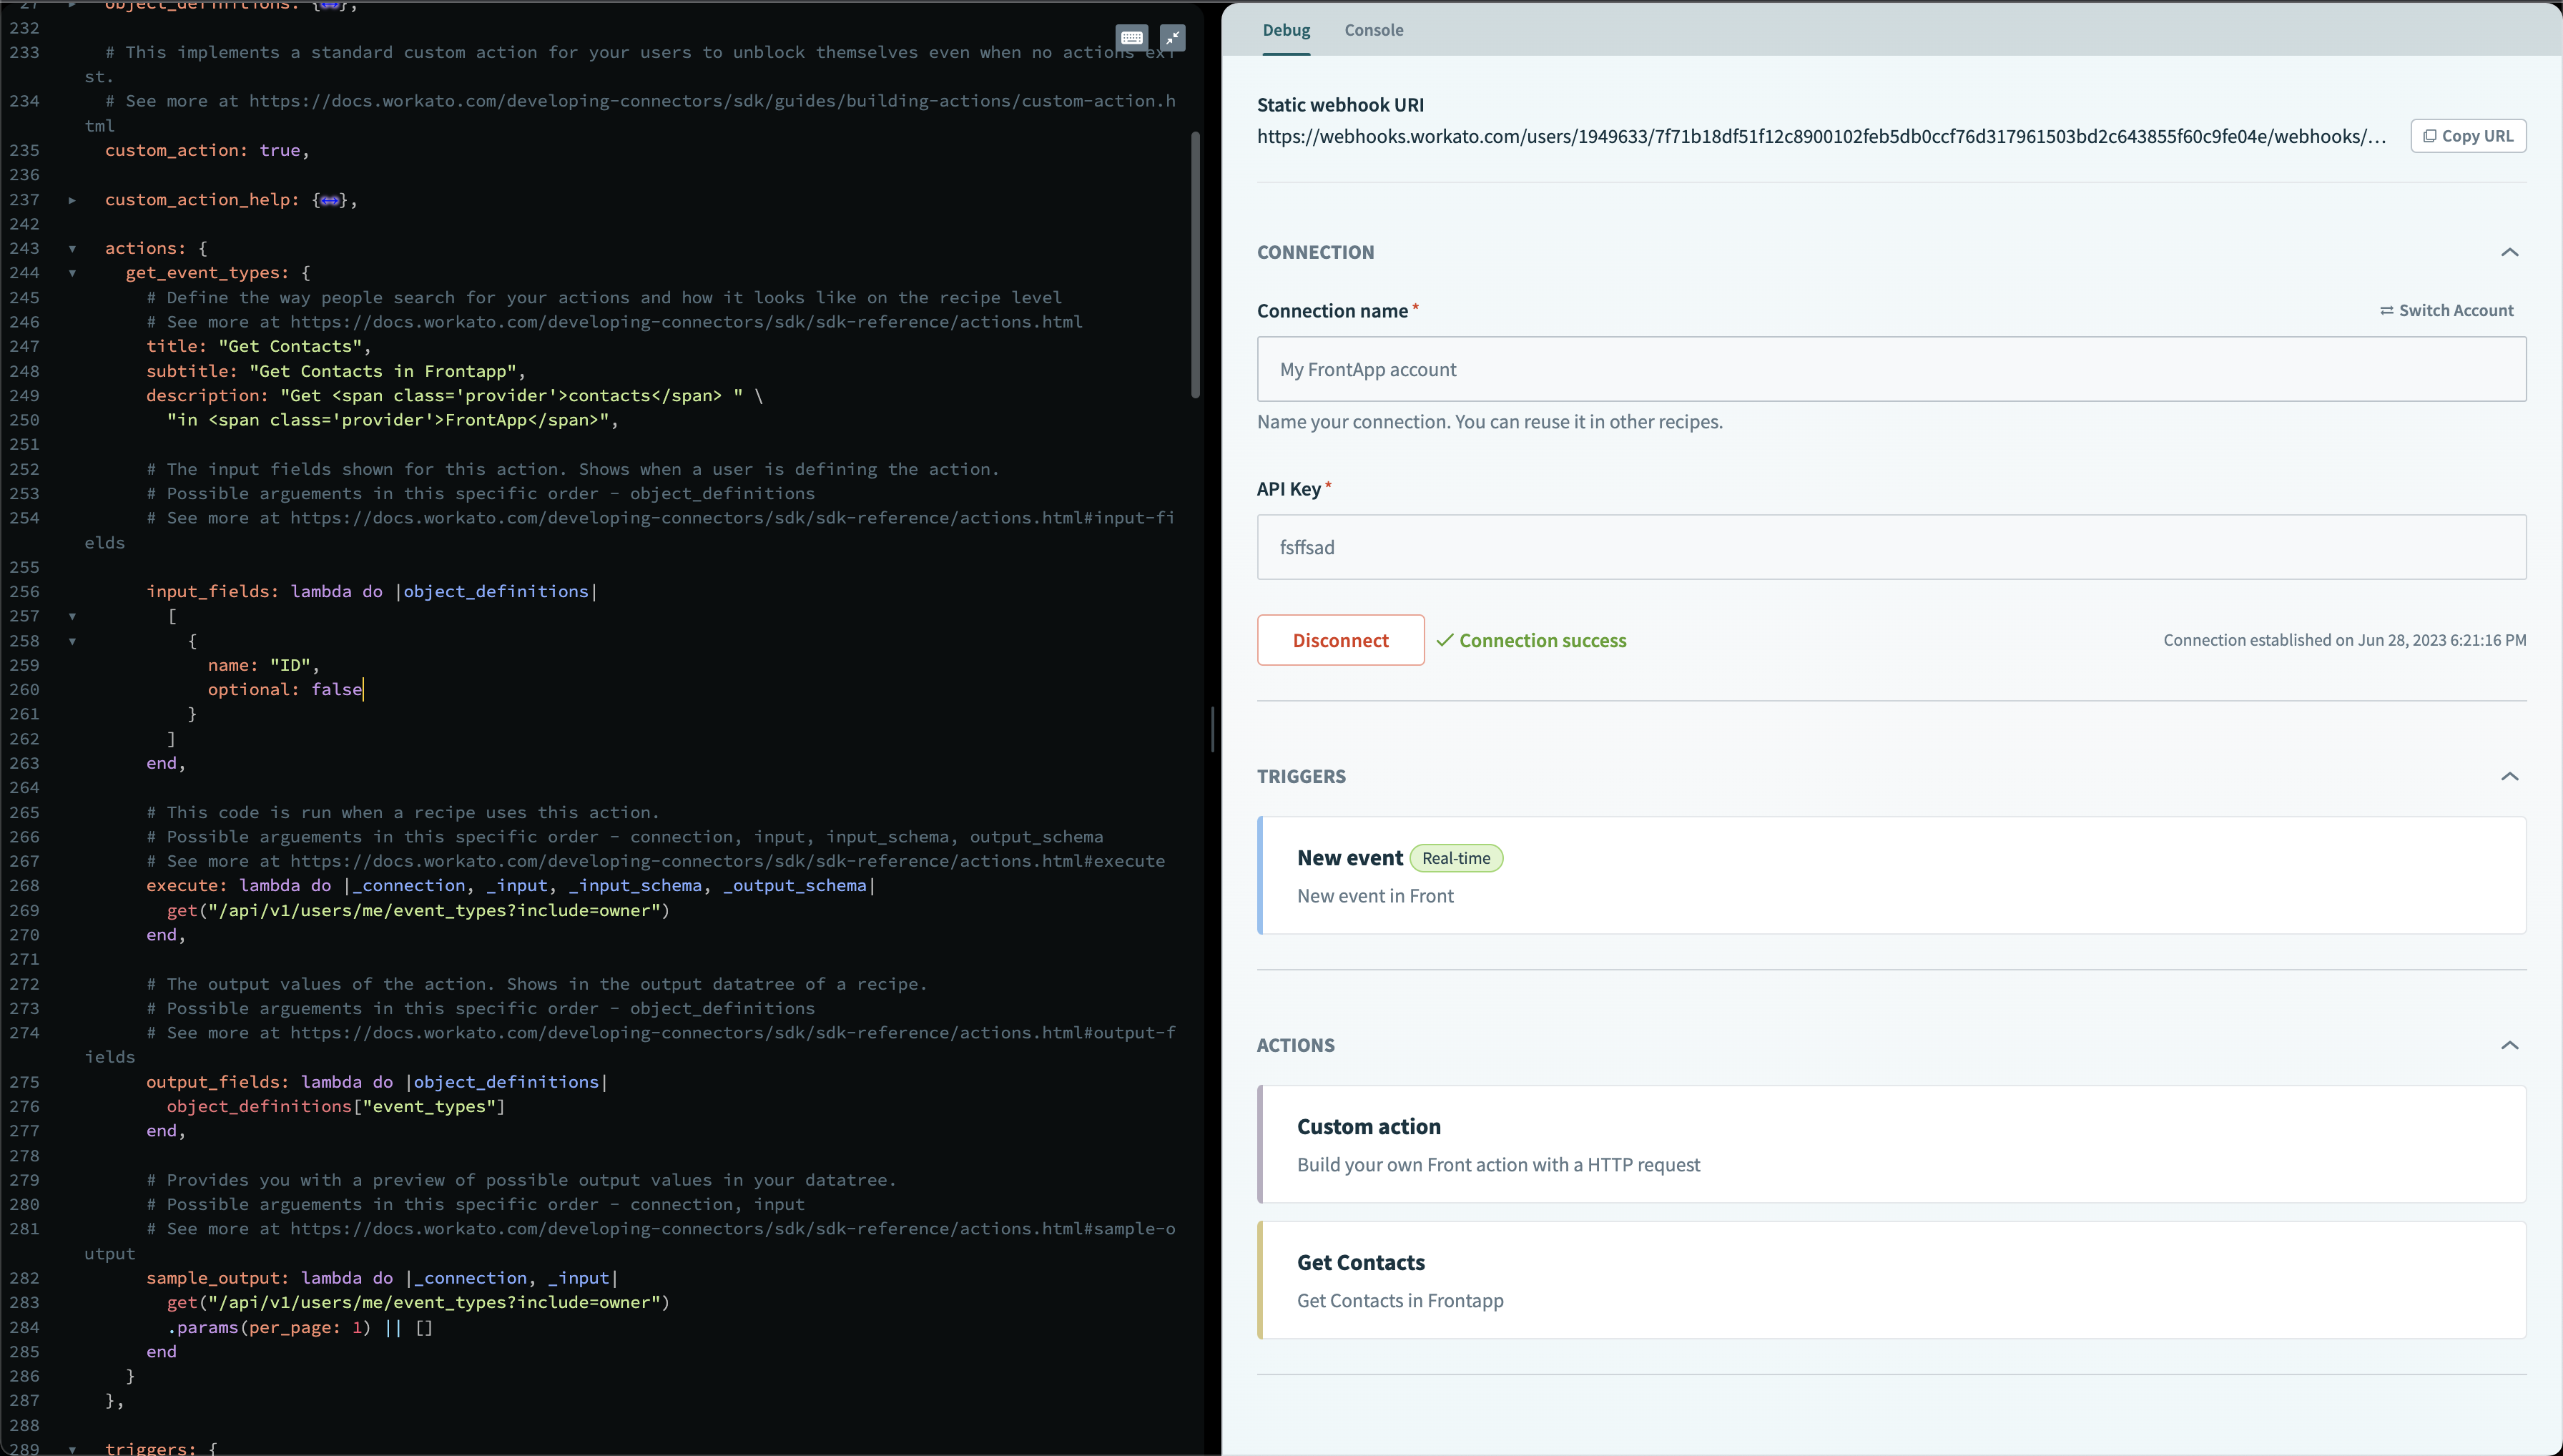 Open up the dropdowns for triggers or actions to see the full list available in your latest version
To test an action or trigger, you will need to click the test button next to it. This will bring up a new window which mimics the action or trigger in the recipe editor. When you attempt to test the action or trigger, any changes to your connector code will be saved first before the test begins.
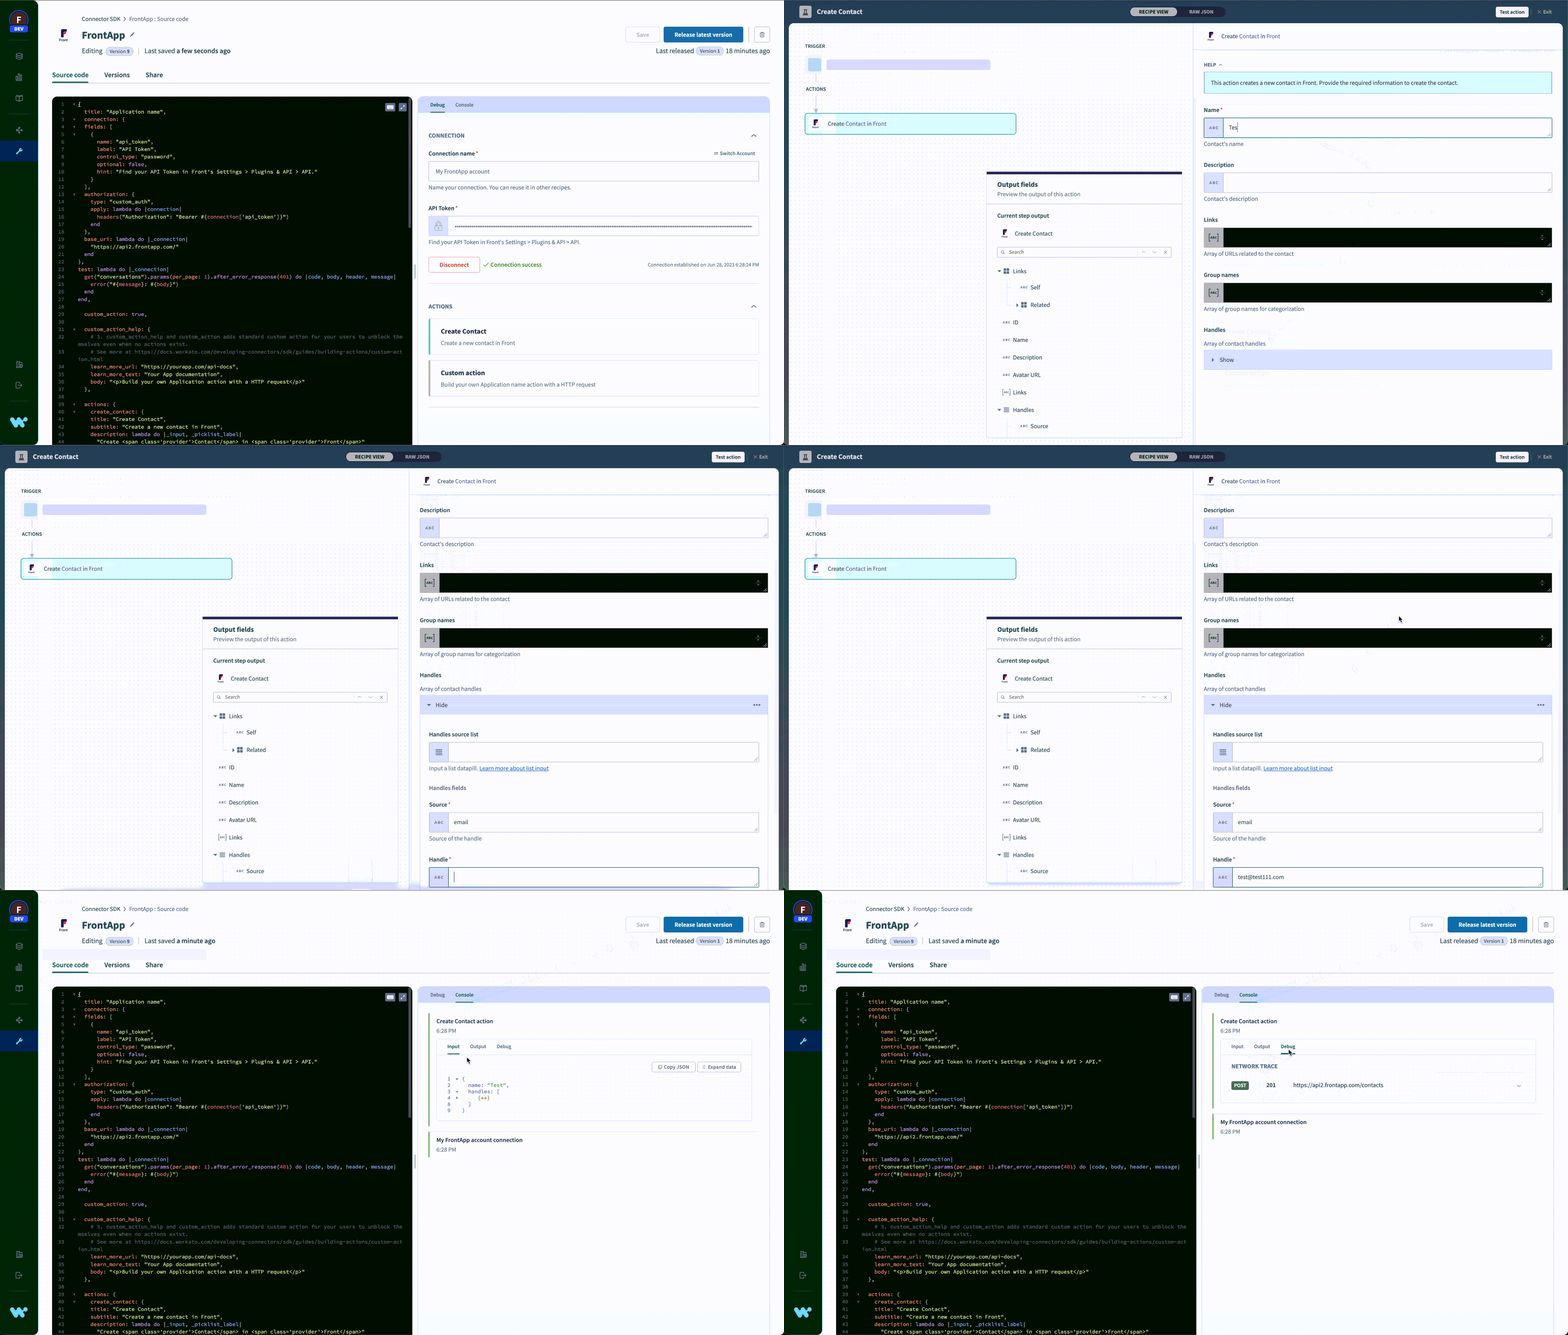 Popup during testing
Besides the input and outputs of the action or trigger, you'll also be able to see the network activity triggered such as any API requests sent. The console tab shows the result of any puts ruby methods that were executed during the test. This is especially useful for debugging and shows even if the test was unsuccessful due to a logic error in the action or trigger.
In the event of unsuccessful tests, the debugger console would feature red accents and also feature an additional tab called error. In this tab, you would be able to see the error message raised due to the logic error as well as the exact line of code that causes our framework to raise this error. In the event that the line of code was raised in a block other than the execute block, we also provide a trace of the lines of code called that lead up to the final error.
# Rerun test
After testing your SDK, you may have to make edits or change the configuration of your action. Quickly test your changes by rerunning a recent test.
Your recent test actions are stored and accessible from the code editor. This allows you to rerun tests without needing to jump to the test editor and setup input data every time you make code adjustments.
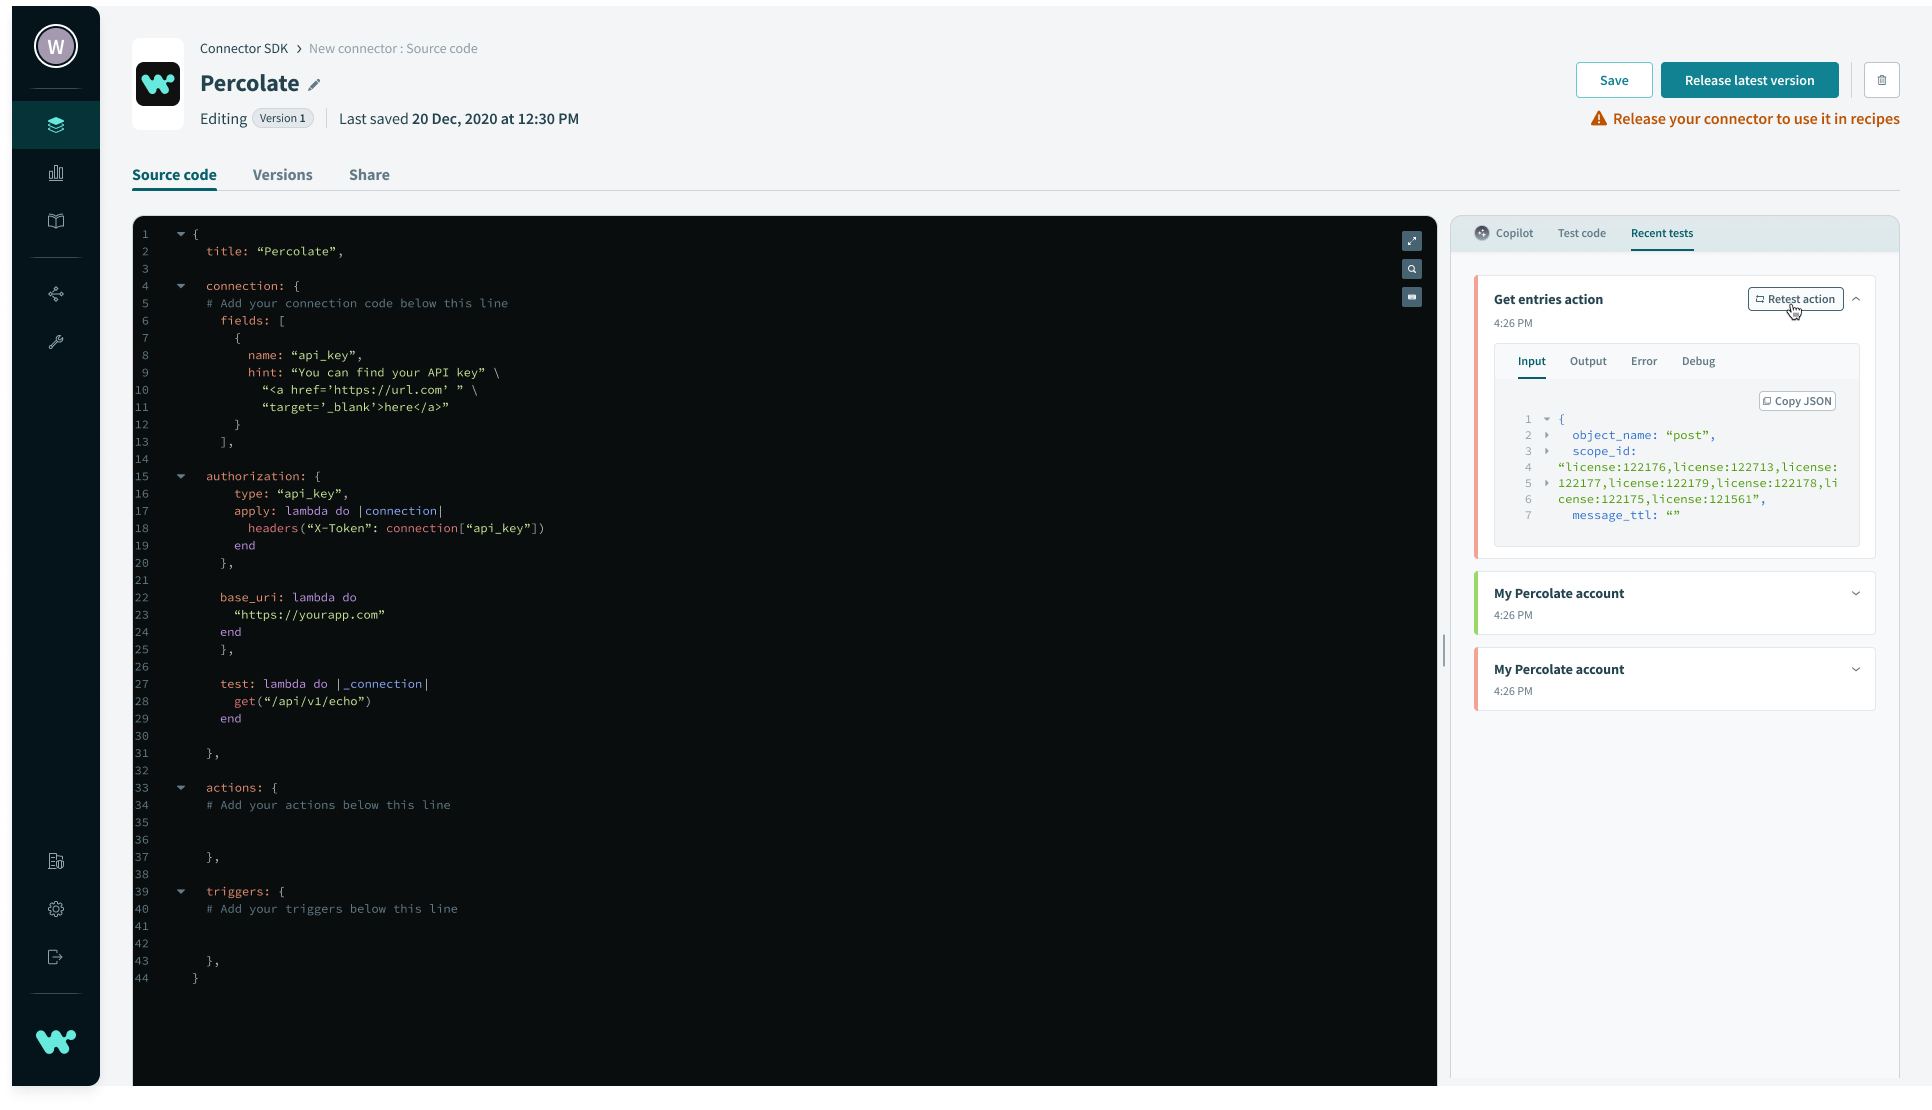 Rerun test from the debug console
Last updated: 3/11/2024, 2:00:45 PM