# Dashboard
Workato's Dashboard allows users to visualize real-time data pertaining to the recipes and connections in their Workato account at a glance. It provides key insights, analytics, and actions so you can discover and resolve issues faster.
Recipe jobs can directly correlate to business metrics: For example, the number of new customers that are added to your CRM daily or the number of invoices that were processed that month. The Workato Dashboard allows users to see trends across time and find outliers that directly impact your businesses.
Additionally, it enables users to obtain a snapshot of the account's recipe issues and tackle them more efficiently. Alongside error notification emails, the dashboard goes a step further and helps target the issues that matter — get a big picture view of recipe health, then drill down to the details that stand out without going through individual recipes.
This guide will enable users to use the Workato Dashboard to the fullest and obtain the most accurate insights possible.
# Dashboard sections
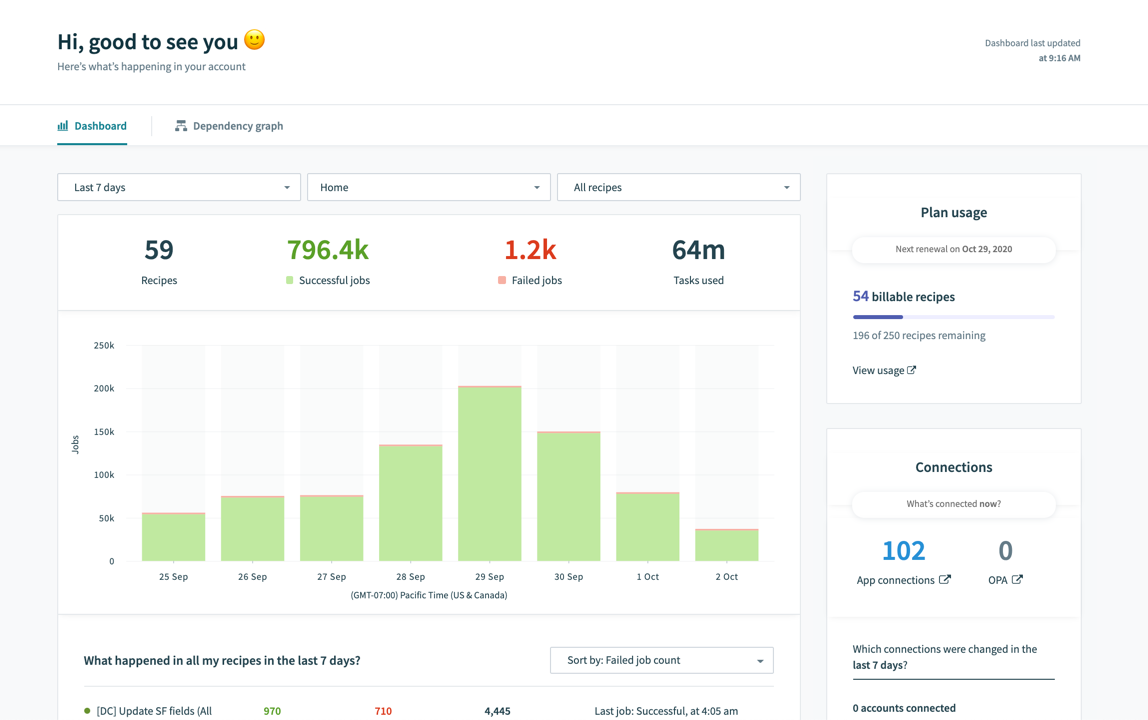 Workato Dashboard
The main view of the dashboard consists of:
- Jobs graph for a big picture view of recipe health
- Recipe details table for a more detailed breakdown by recipe and sorting
- Plan usage section for billing usage statistics
- App connection overview for changes made to connections in the last 7 days
Each section of the dashboard aims to give you operational metrics that will help you obtain a 360° view of the recipes in your workspace.
# Jobs graph
This gives users an overview of their recipes' health in a given timeframe. This snapshot is dynamic and will change according to the filter parameters that you define. Use the filter tools to modify the Jobs graph to show information about key folders/recipes.
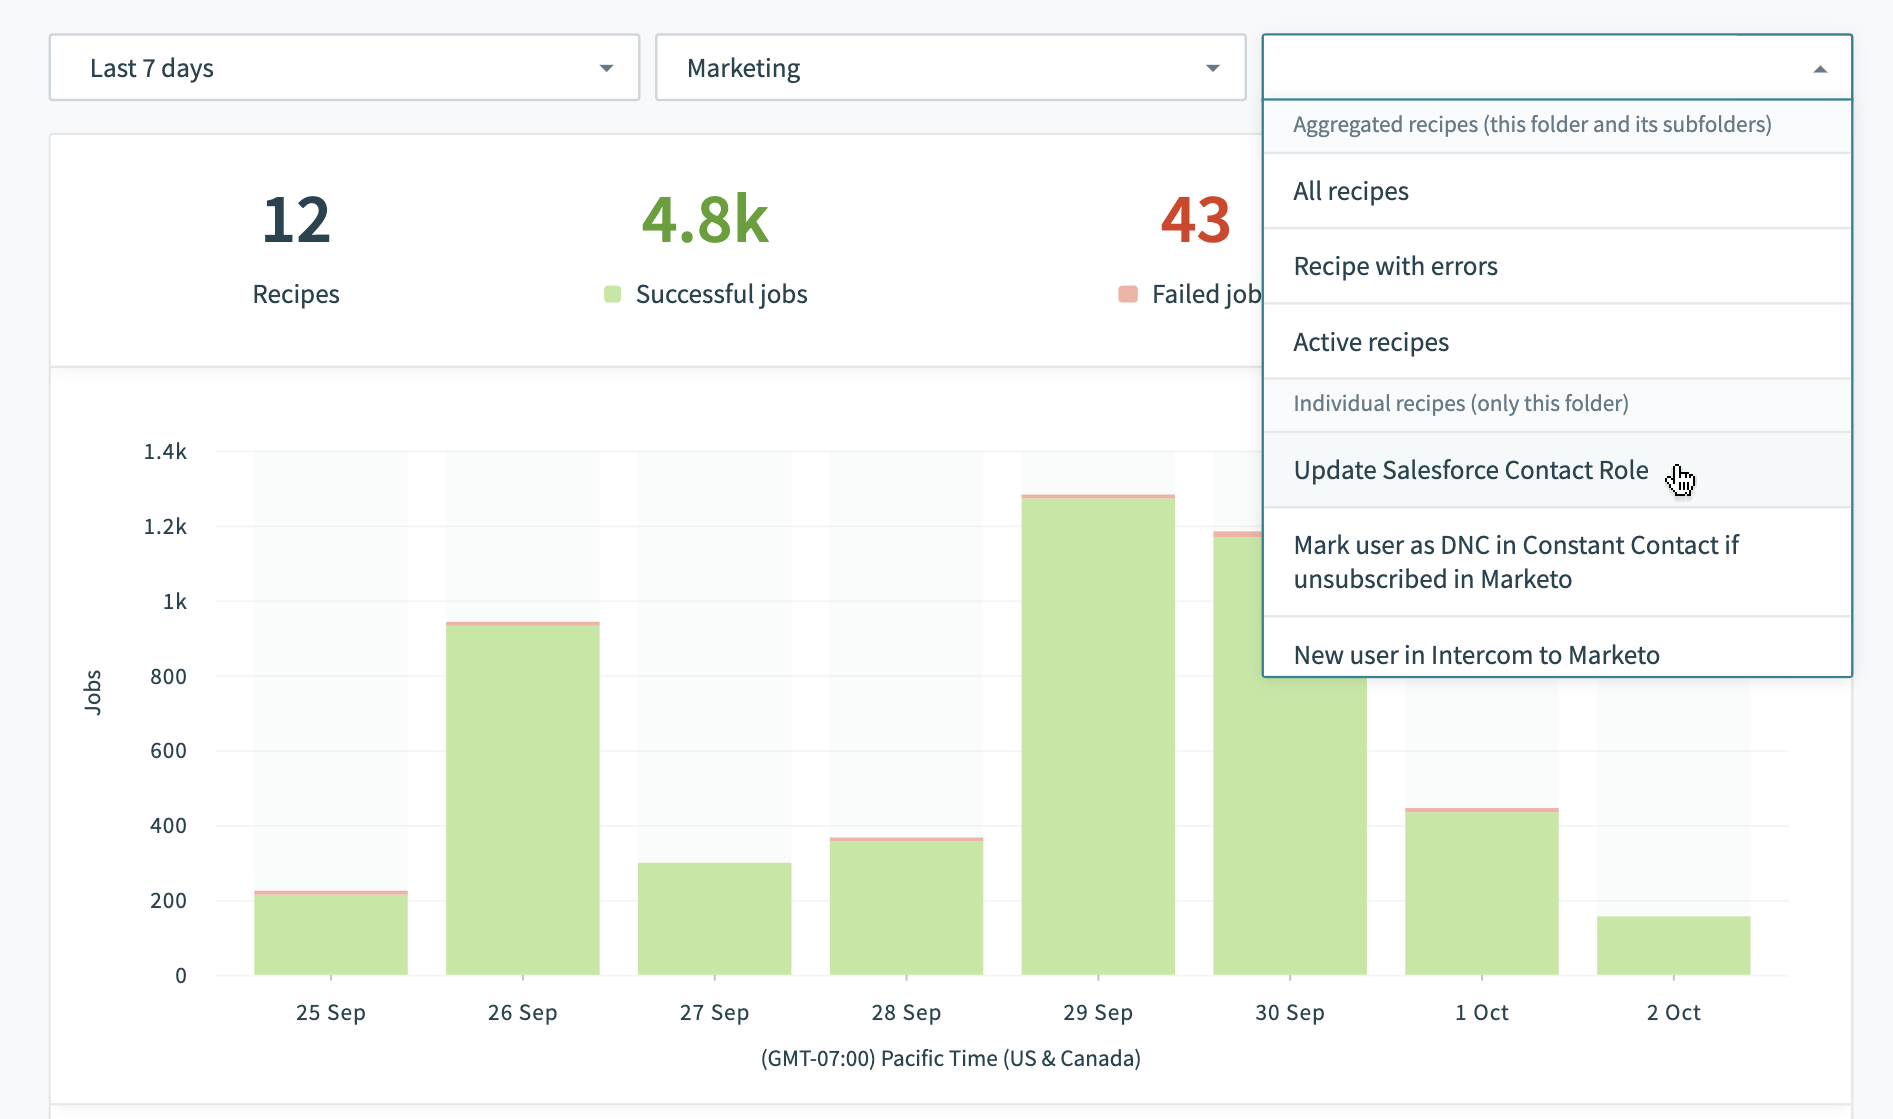 Jobs Graph
For example, we can use the comprehensive filters on the top of the graph to change the graph view to show data for the Marketing folder or even down to a specific recipe within the marketing folder.
# Date, status, & folder filters
Workato Dashboard allows you to customize your filters by Date, Recipe status, and Folders. By default, the filters are set to Last 7 days, Home and All recipes.
| Date filter | Folder filter | Recipe and status filter |
|---|---|---|
| Select the timeframe that you want to observe. | Filter your dashboard view by folder. | Get more insights by diving into folders and sub-folders. |
Use one of the dropdown selections or define a custom range. The default is set at 7 days. | Select the folder or sub-folder you want to examine or default to the Home folder. | Select from recipe statuses: All recipes (default), Recipe with errors and Active recipes or select a single recipe. |
To define a custom date range, select Pick a date range from the date filter. Fill in the start date and end date in the mm/dd/yy format. You can use the calendar picker for convenience. There is no limit on the number of days that can be selected.
# Interacting with the graph
Users can hover over each individual bar to view the number of successful and failed jobs done within that time, as well as the number of tasks done.
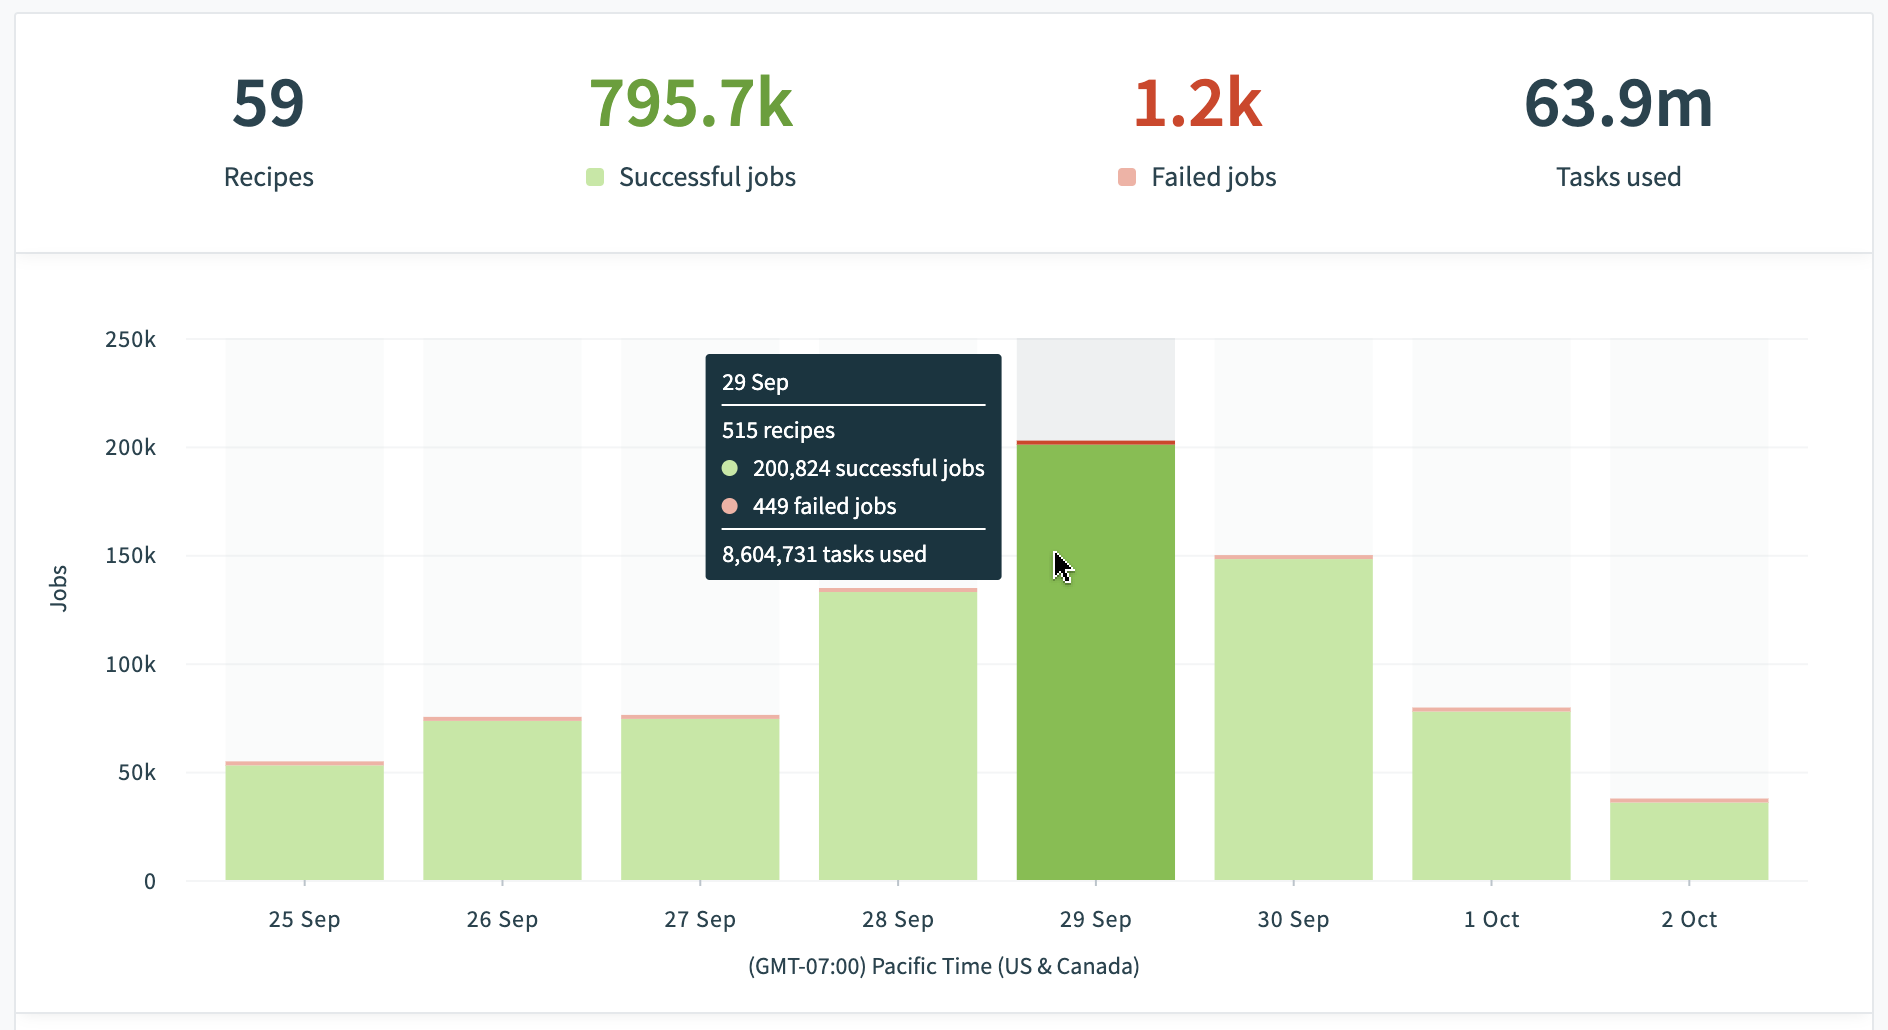 Interacting with the jobs graph
To obtain a breakdown by a specific section of time,
# Recipe details table
This section further dissects the jobs graph by individual recipes. It displays key information like successful jobs, failed jobs, tasks used and a description of the latest job.
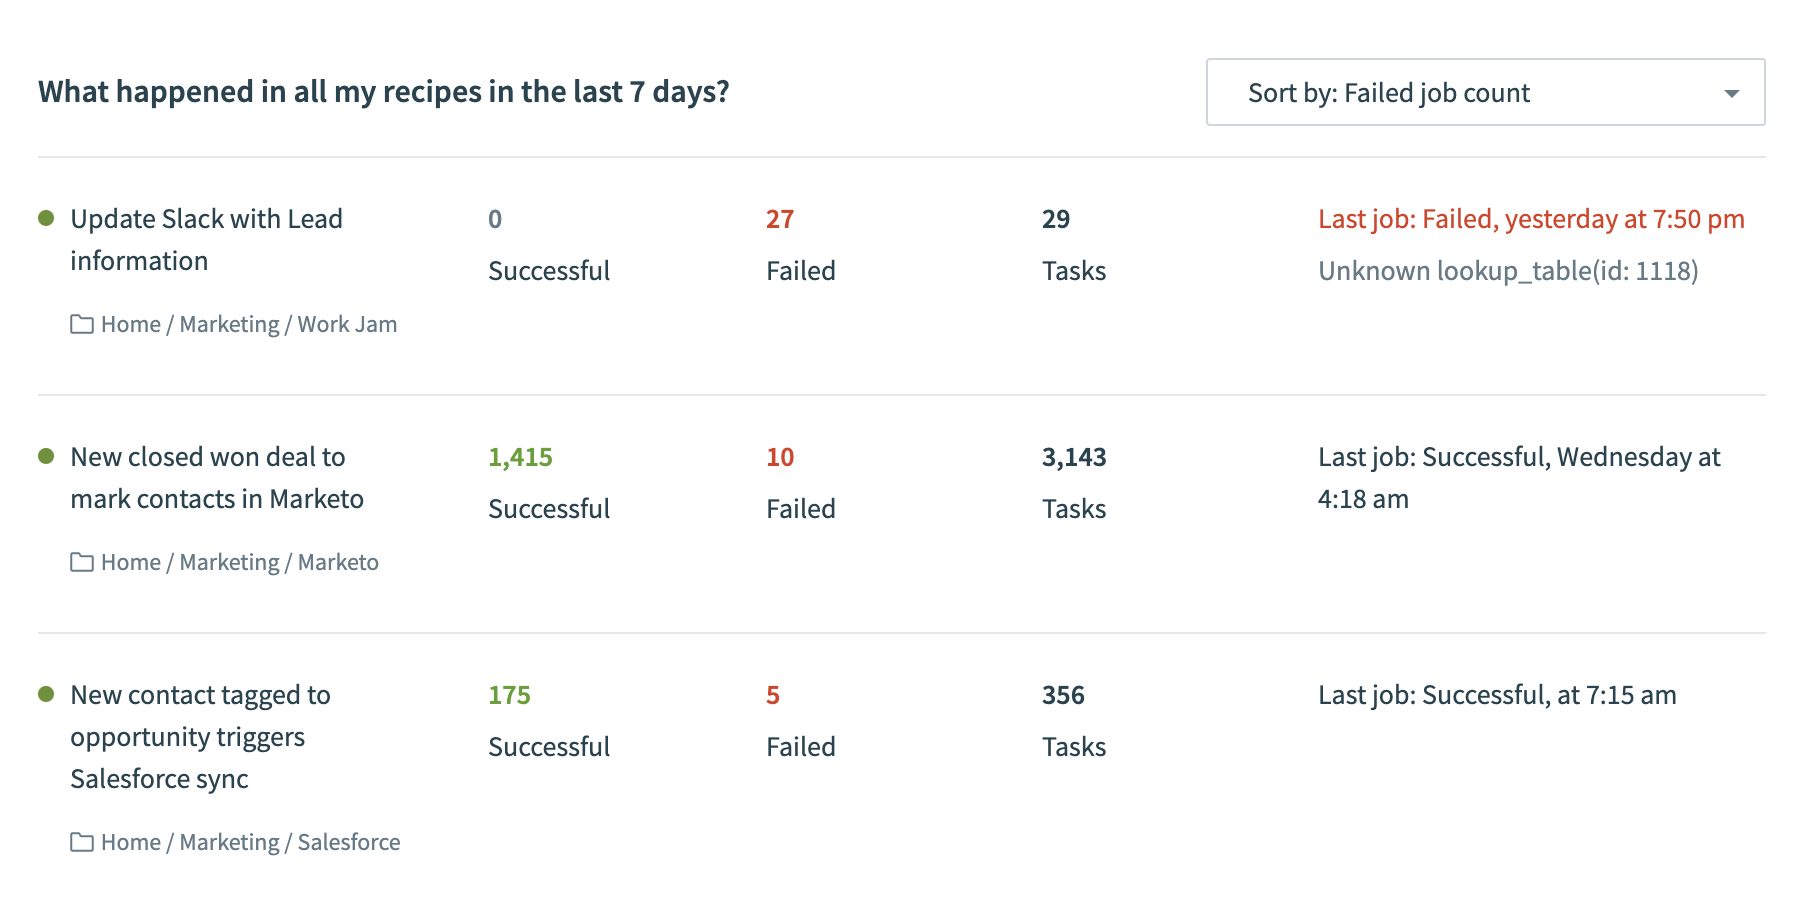 Recipe details table
Select the relevant cells to find out more. For example, find out more about the Failed jobs by select 13 Failed. This will bring you to the corresponding jobs tab on the recipe page.
If you have applied date and time filters, you will find that the jobs will be filtered automatically when you are redirected to this page
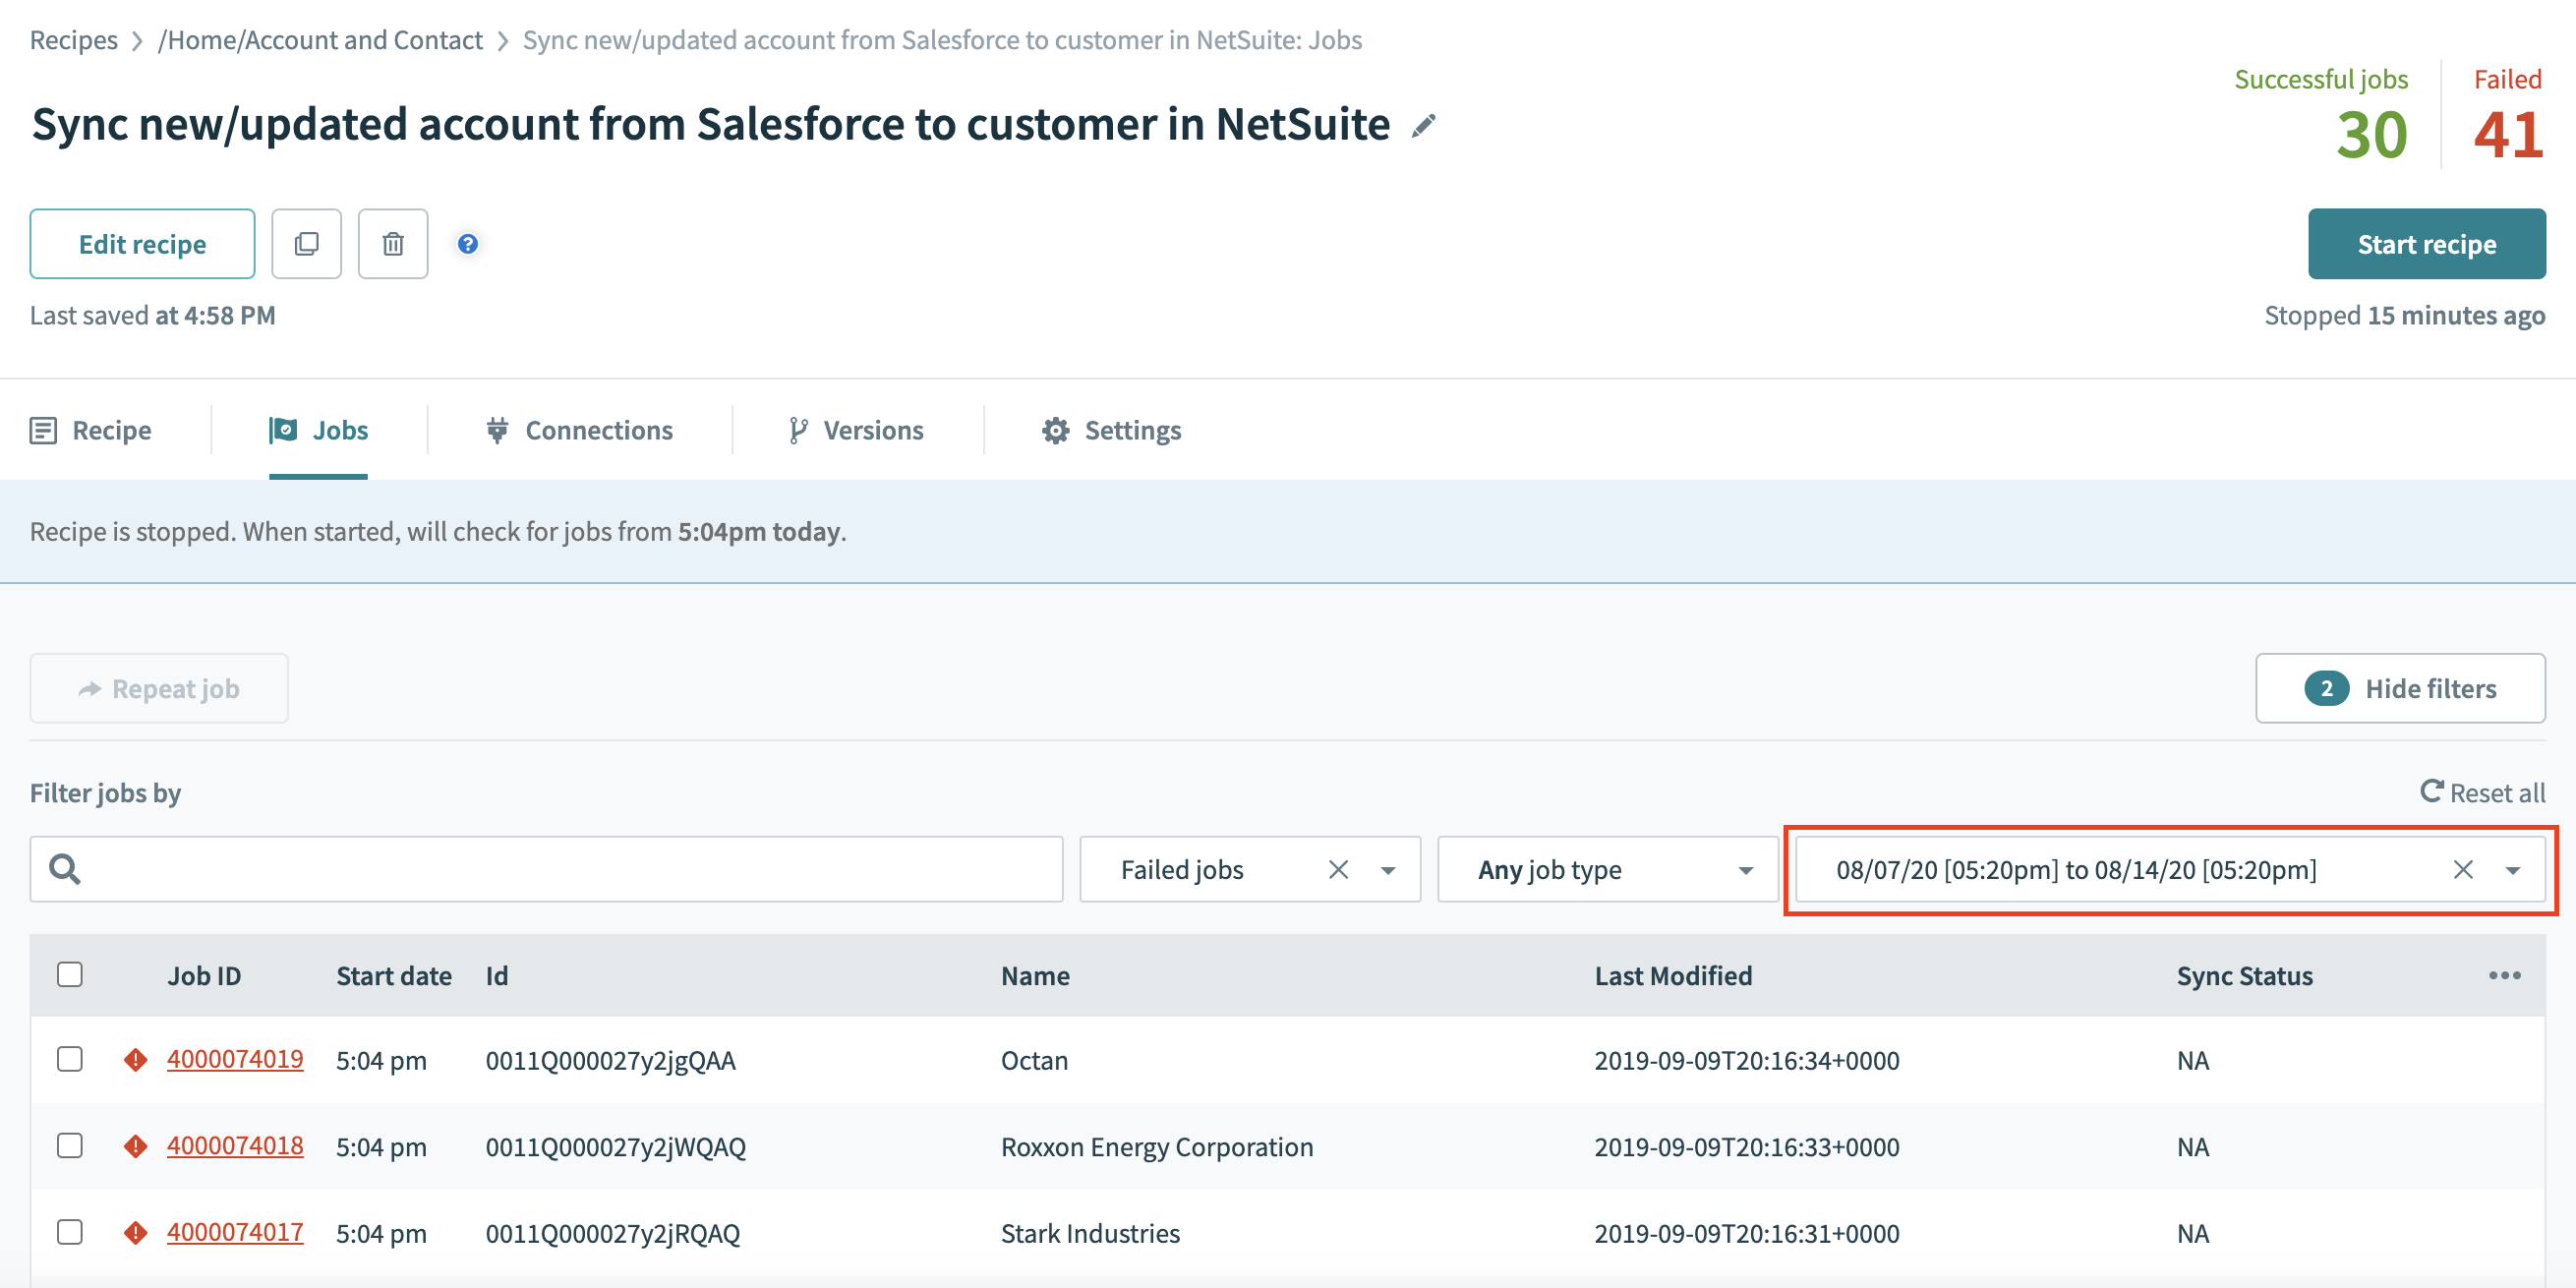 Jobs tab filtered with specified date range
The filter feature allows you to rearrange the list by different priorities.
- Select
Failed job countto identify the recipes that have the most number of failed jobs that require troubleshooting. This is the default selection - Select
Recipe statusto see inactive recipes before active ones - Select
Successful job countto view the recipes with the highest number of successful jobs - Select
Tasks usedto view the recipes with the highest number of tasks - Select
Recent jobto view the most recent job across all recipes
# Plan usage
The plan usage section in the dashboard allows users to identify the usage based on their Workato subscription plan. This section will differ based on plan type. This is not affected by the date filters you apply on the main dashboard graph.
# App connection overview
This section provides a quick way to monitor the changes to app connections in your Workato account. Note that the list of accounts connected and disconnected refers to changes made in the past 7 days. This section is not affected by the date filters you apply on the main dashboard graph.
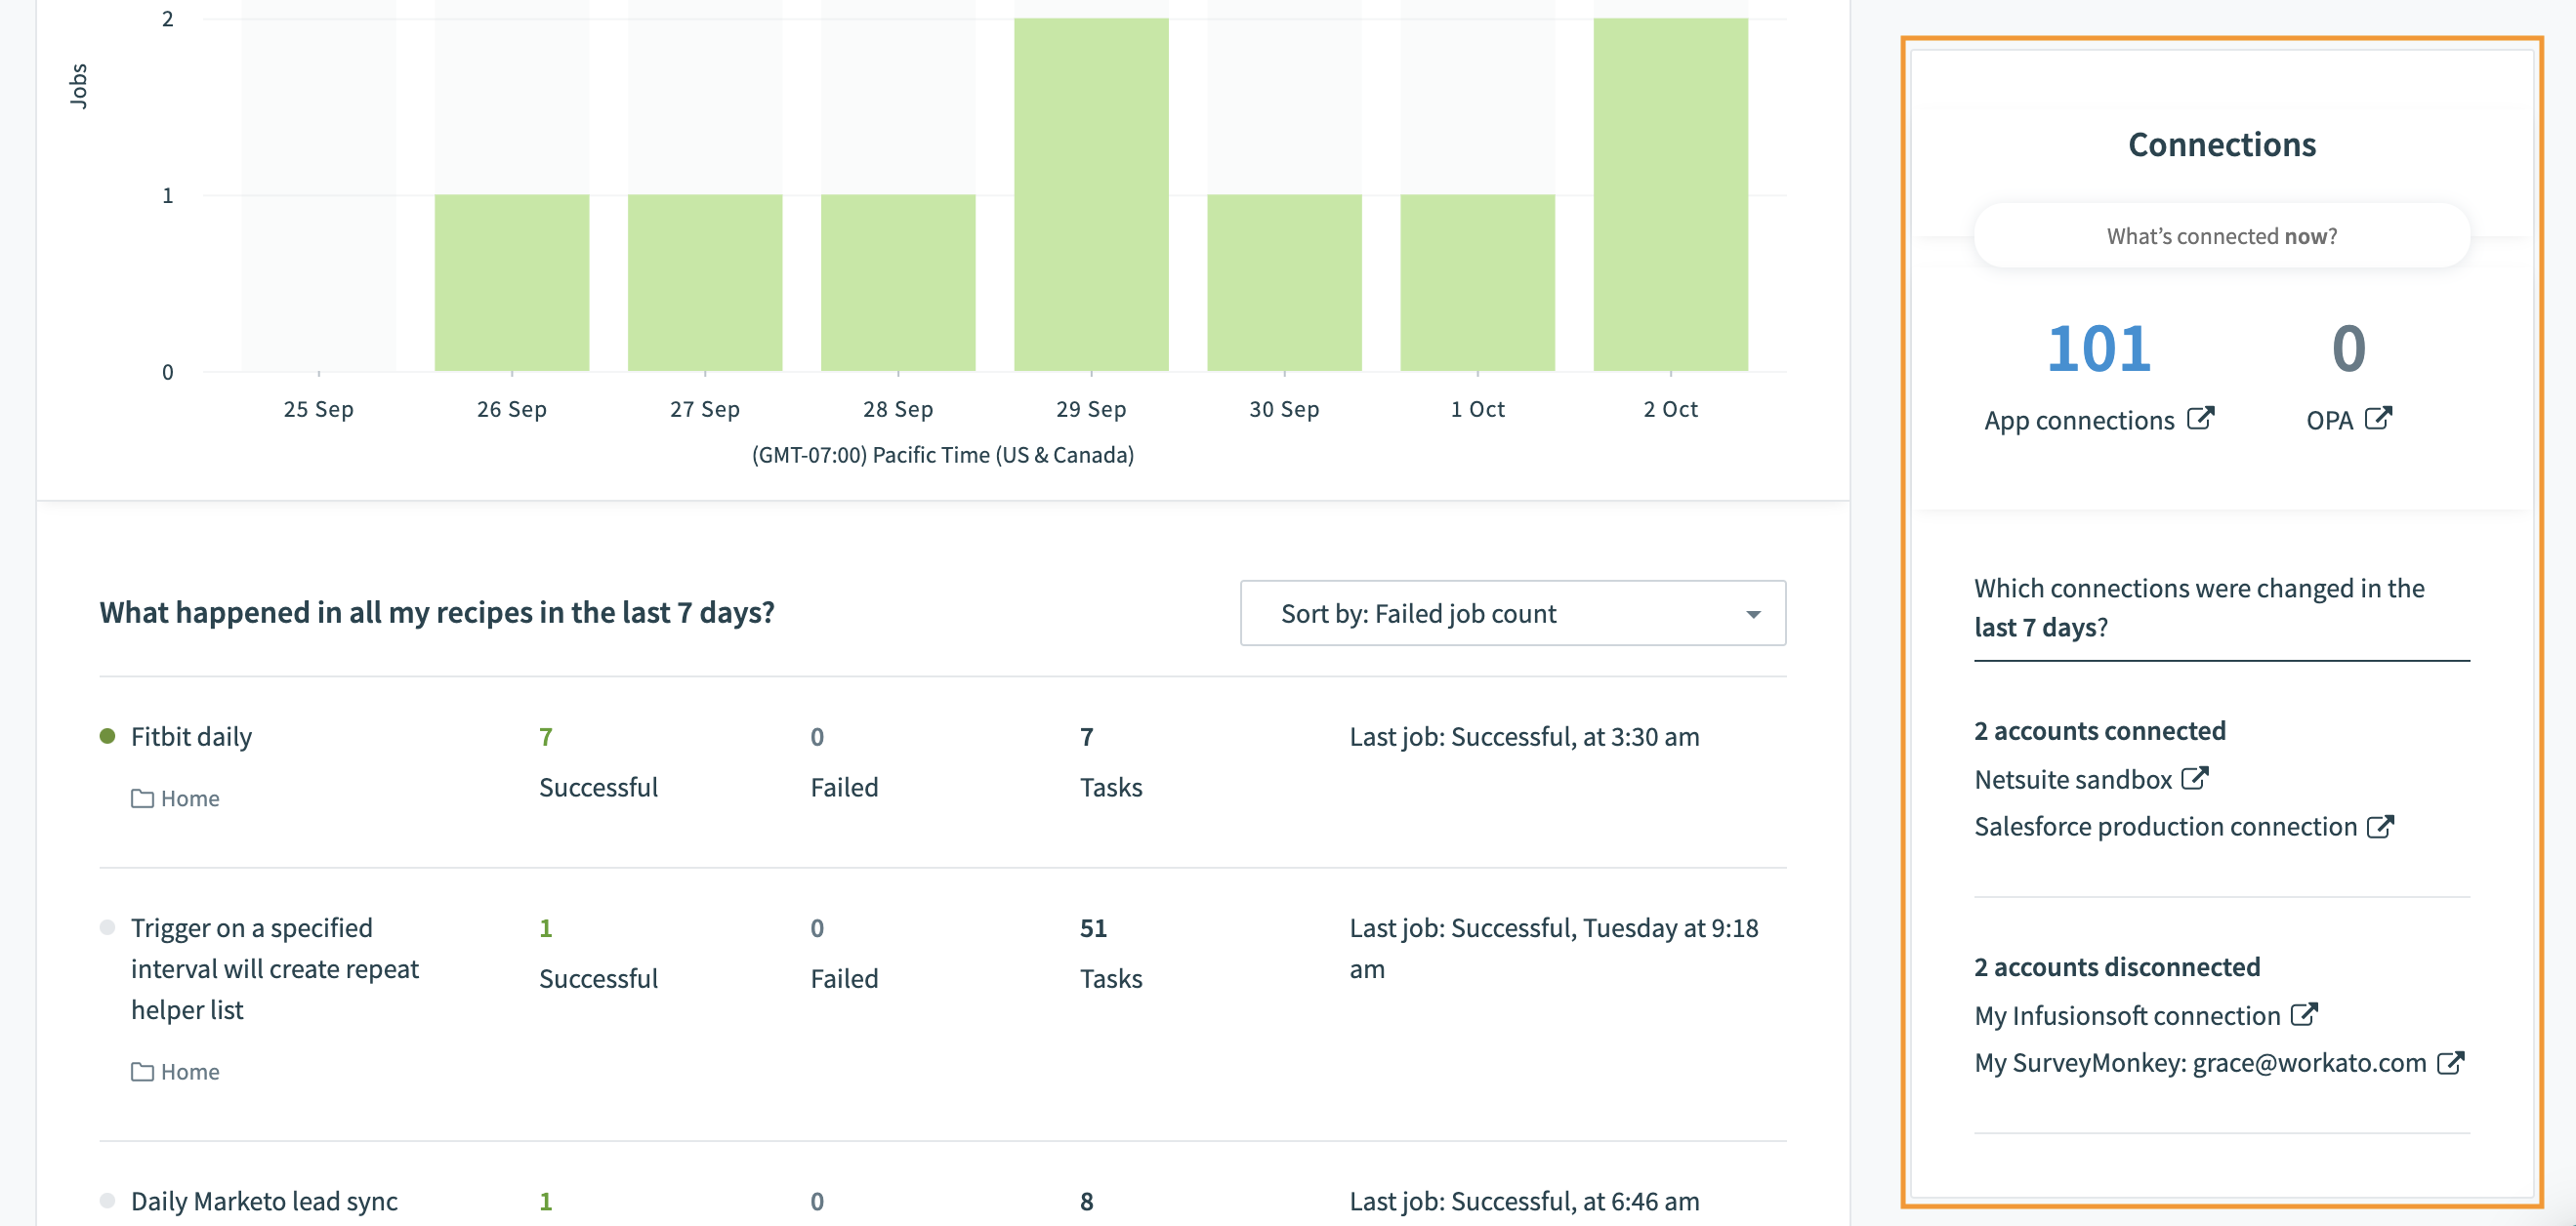 App connection overview
| Feature | Description |
|---|---|
| App connections | The total number of active connections. This refers to connections that are currently used in a recipe. |
| OPA | The total number of On-Prem Agents on this account. |
| Accounts connected | A list of accounts that were connected in the last 7 days. |
| Accounts disconnected | A list of accounts that were disconnected in the last 7 days. |
Last updated: 2/26/2024, 6:03:13 PM