# API Platform Dashboard
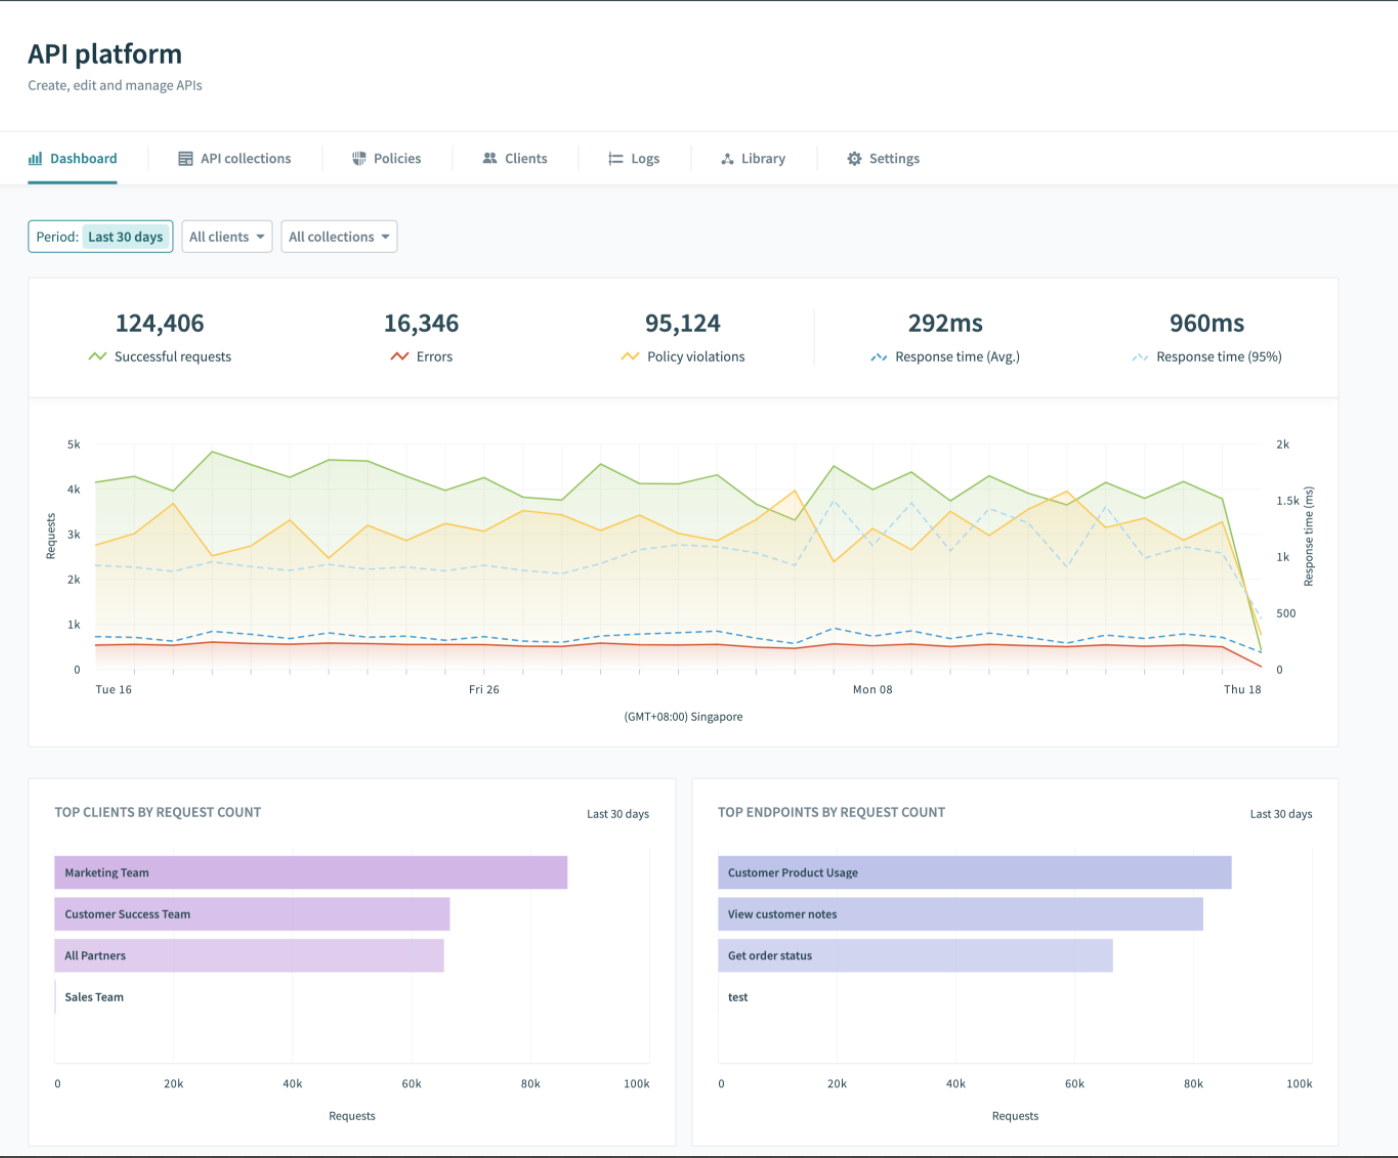
The API platform dashboard allows owners of the API platform to visualize real-time data pertaining to the endpoints and API collections at a glance.
 API Dashboard Tab
Monitor the performance of your API platform as a whole, or get granular data about a specific endpoint collection or requesting customer.
Successful request and Errors provide a big picture view of the health of your API endpoints.
Use the Policy violations metric to identify key clients or collections that produce abnormal API calls. See here for more information on API Access Policies.
# Filters
Use filter parameters to modify the dashboard output. By default, the dashboard is set to Last 30 days, All clients and All collections. You can change the filters to find your preferred dashboard view. Filters will reset once you leave the page.
 API Dashboard filters
| Date filter | Client filter | Collections filter |
|---|---|---|
| Select the timeframe that you want to observe. | Filter by specific clients. | Get more insights by diving into collections and specific endpoints. |
# Top request count
Finally, obtain aggregated data about who your most active API consumers are, as well as your most popular endpoints. This display will change according to the filters you specified above.
 Top request count
To see details of each endpoint request, navigate to the Logs tab.
Last updated: 7/2/2021, 10:09:23 AM